Had some fun talking to the fine people at the PDAVP and wanted to post some links.
The video:
Introduction to dbatools
Their awesome virtual chapter:
Data Architecture Virtual Group
The code:
Had some fun talking to the fine people at the PDAVP and wanted to post some links.
The video:
Introduction to dbatools
Their awesome virtual chapter:
Data Architecture Virtual Group
The code:
I was going to dive into a little less meaty topics to start my PowerShell series but I have had a couple requests for debugging pop up, and so that’s where our journey begins.
It’s a little backwards, but I hope you learn a bit about Set-PsBreakpoint and how to ask the shell a few more questions about what the heck it is doing.
Debugging often comes up when you get beyond the super trivial questions and start asking “what is this magical thing doing for me?”
I wanted to include a few terms that may be familiar or may not be (and that’s ok!), but they are good to know when approaching a debugger.
Most commonly when people start debugging their programs they reach for what they know, which is printing stuff to the screen. This is generally considered “printf debugging” (from the old C programming language days), and it has a fairly predictable approach:
$VerbosePreference="Continue" or $DebugPreference="Continue" to get results.)
This is a completely valid way of debugging a problem and one I use regularly (especially in SQL), but as you may know there are other methods such as tracing/profiling and in our case, a great debugger!
Any new set of commands can be a complex task, but thankfully with PS you really only need to spend some time on Set-PsBreakpoint, everything else is just supporting that command or outside the scope of this blog post 🙂
Remove-PsBreakpoint or Disable-PsBreakPoint so that you can start fresh or quickly disable breakpoints for a “clean run”.Set-PsBreakpoint, I dont often use this or Enable-PsBreakpoint because of the technique I list a bit later creating a debug script.Set-PsBreakpoint.Set-PsDebug -Trace 2 – Allows you to notify EVERYTHING that you want to get deeper debugging information, internal commands will notify you much more about what they are doing.Set-StrictMode -Version 2.0 – This allows you to have a more strict interpretation of what is valid code in your script. StrictMode will complain about references to variables you never initialize, references to properties of an object which do not exist, variables without names and a few less important things.Trace-Command – Allows you to trace execution of a command, (included for completeness but it is a bit outside of our scope right now, we will come back to it in a later post.)Let’s look at an example, and show you what I am talking about!
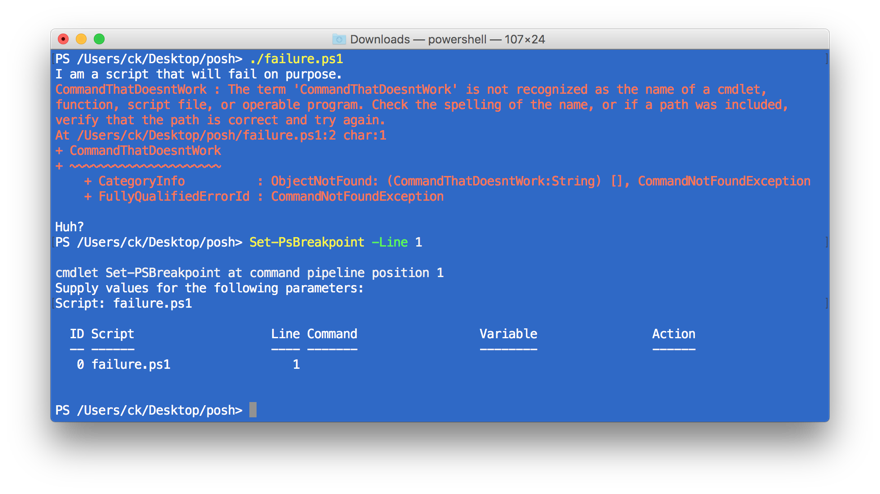
Say you are writing some PS and run into an error:

You may notice that the line number itself is thrown in the error message, and one of the things that helps us as a human when debugging an issue in our code. But in this case we can use the line number (and the script) to tell PS to break at that point in the execution and let us start doing things.
So, let’s start the debugger BEFORE my error occurs and watch it happen 🙂
First we set the Set-PsBreakpoint to break before the line number that threw the error (I forgot to add the script part, so PS helpfully asked what I was talking about.)
We re-run the command and now we can check out the commands available at this point with ? or h this breaks out which shortcuts are used to stepInto, stepOver, stepOut, continue, quit, and detach.
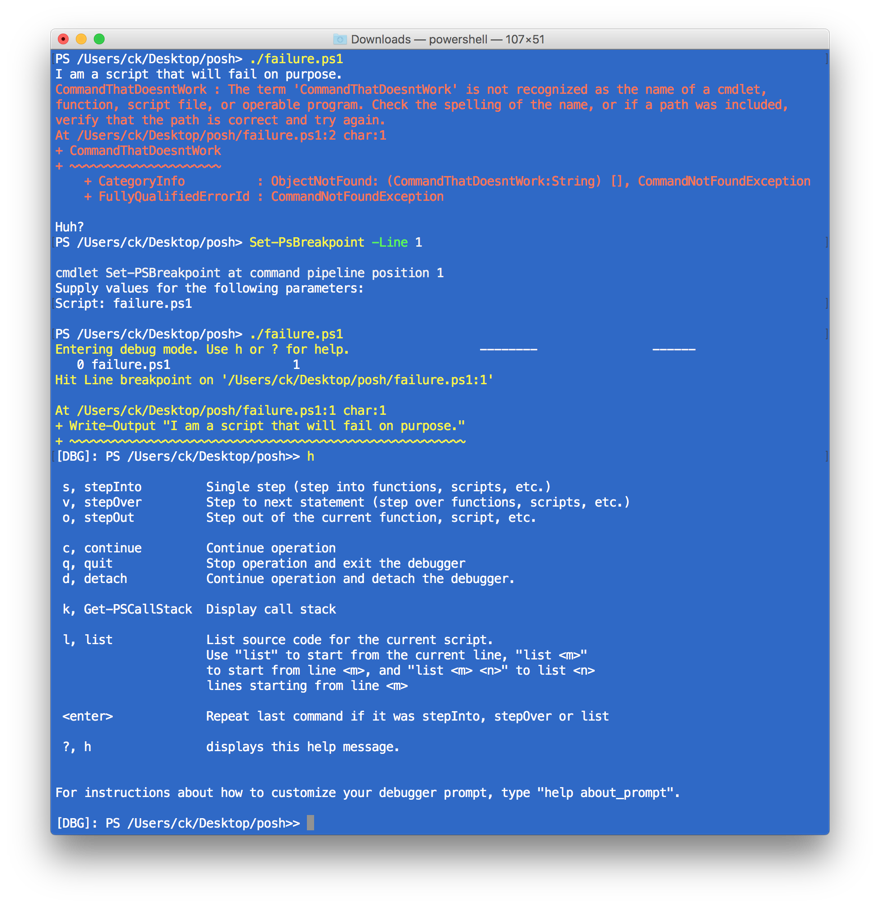
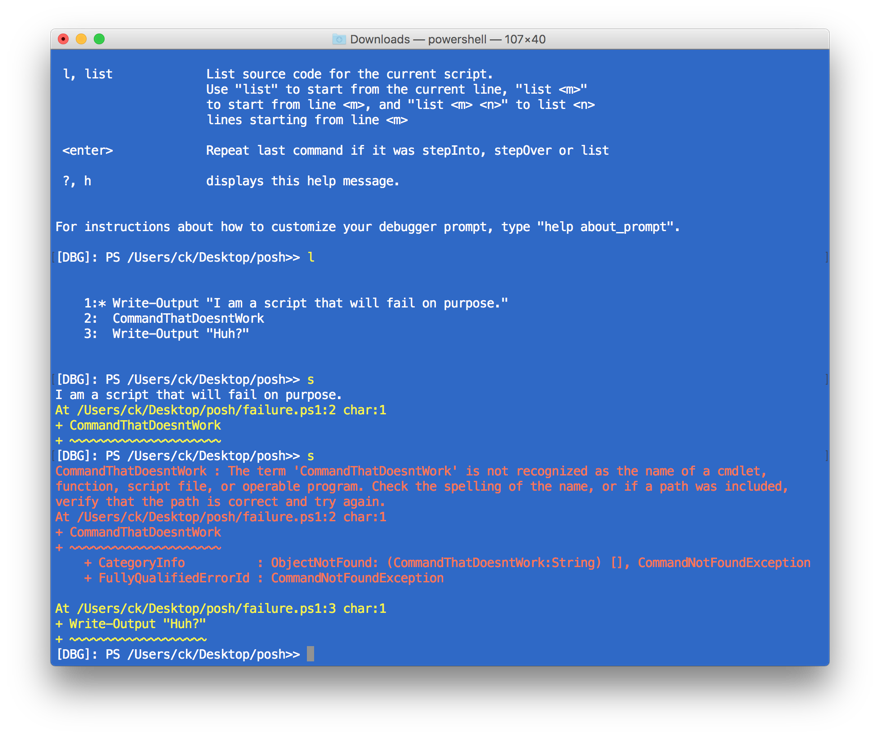
Use l to list the source code and where you are in the script execution will be marked by a star.

If we start stepping into the code with the s (step into) key (and enter) we can see the first line executing (and showing additional debug information printing the next line) and then the error message, just as before when we ran the entire script.
We can also run our own commands and treat the current debugging context as a normal shell. That means you can call internal variables, functions, you name it, if the script can use it you can use it. (This does not apply to $psboundparameters or the pipeline operator $_, if you want to check the values of these you must assign them within your script.)

If the problem gets more complex than that, I setup a simple “debug and invoke” script, so I can add additional breakpoints at will.

I wanted to show you the shell version because I want to constantly reinforce that PowerShell is really built for you to use as a shell first; these debugging commands are among the easiest I have ever used in a programming language, I didn’t have to suss out any weird flags and the REPL is super friendly.
I also want you to understand when you use Visual Studio Code, the PowerShell ISE, or some other tool that the debugging that is available is generally the one you always have anyway, you dont need some heavy tool to figure out what is wrong with your program!
If you want to get fancier (and potentially emulate some of the additional heavy hitter features of VS Code like watching the value of variables change), Set-PsBreakpoint can also do things like set conditions and fire scriptblocks when you hit your condition and allow you to perform certain actions instead of just break.
A common case is to add additional tests to your breakpoints so that you can ask things like “If the value of $var is X, then break” for things like “I want to break on the fiftieth time this runs” or “If this is true then break”.
The Get-Help Set-PsBreakpoint page shows a lot of really interesting additional examples that I wanted to briefly trot out for completeness, and to remind you that PowerShell help is solid as heck.
Check out more on the online help for Set-PsBreakpoint
PS C:\> Set-PSBreakpoint -Command "Increment" -Script "sample.ps1"
This command creates a command breakpoint on the Increment function in the Sample.ps1 cmdlet. The script stops executing immediately before each call to the specified function.
PS C:\> Set-PSBreakpoint -Script "sample.ps1" -Variable "Server" -Mode ReadWrite
This command sets a breakpoint on the Server variable in the Sample.ps1 script. It uses the Mode parameter with a value of ReadWrite to stop execution when the value of the variable is read and just before the value changes.
PS C:\> Set-PSBreakpoint -Script Sample.ps1 -Command "write*"
This command sets a breakpoint on every command in the Sample.ps1 script that begins with write, such as Write-Host.
PS C:\> Set-PSBreakpoint -Script "test.ps1" -Command "DiskTest" -Action { if ($Disk -gt 2) { break } }
This command stops execution at the DiskTest function in the Test.ps1 script only when the value of the $Disk variable is greater than 2.
It uses the Set-PSBreakpoint cmdlet to set a command breakpoint on the DiskTest function. The value of the action is a script block that tests the value of the $Disk variable in the function.
The action uses the BREAK keyword to stop execution if the condition is met. The alternative (and the default) is CONTINUE.I was going to dive into a little less meaty topics to start my PowerShell series but I have had a couple requests for debugging pop up, and so that’s where our journey begins.
It’s a little backwards, but I hope you learn a bit about Set-PsBreakpoint and how to ask the shell a few more questions about what the heck it is doing.
Debugging often comes up when you get beyond the super trivial questions and start asking “what is this magical thing doing for me?”
I wanted to include a few terms that may be familiar or may not be (and that’s ok!), but they are good to know when approaching a debugger.
Most commonly when people start debugging their programs they reach for what they know, which is printing stuff to the screen. This is generally considered “printf debugging” (from the old C programming language days), and it has a fairly predictable approach:
$VerbosePreference="Continue" or $DebugPreference="Continue" to get results.)
This is a completely valid way of debugging a problem and one I use regularly (especially in SQL), but as you may know there are other methods such as tracing/profiling and in our case, a great debugger!
Any new set of commands can be a complex task, but thankfully with PS you really only need to spend some time on Set-PsBreakpoint, everything else is just supporting that command or outside the scope of this blog post 🙂
Remove-PsBreakpoint or Disable-PsBreakPoint so that you can start fresh or quickly disable breakpoints for a “clean run”.Set-PsBreakpoint, I dont often use this or Enable-PsBreakpoint because of the technique I list a bit later creating a debug script.Set-PsBreakpoint.Set-PsDebug -Trace 2 – Allows you to notify EVERYTHING that you want to get deeper debugging information, internal commands will notify you much more about what they are doing.Set-StrictMode -Version 2.0 – This allows you to have a more strict interpretation of what is valid code in your script. StrictMode will complain about references to variables you never initialize, references to properties of an object which do not exist, variables without names and a few less important things.Trace-Command – Allows you to trace execution of a command, (included for completeness but it is a bit outside of our scope right now, we will come back to it in a later post.)Let’s look at an example, and show you what I am talking about!
Say you are writing some PS and run into an error:
You may notice that the line number itself is thrown in the error message, and one of the things that helps us as a human when debugging an issue in our code. But in this case we can use the line number (and the script) to tell PS to break at that point in the execution and let us start doing things.
So, let’s start the debugger BEFORE my error occurs and watch it happen 🙂
First we set the Set-PsBreakpoint to break before the line number that threw the error (I forgot to add the script part, so PS helpfully asked what I was talking about.)
We re-run the command and now we can check out the commands available at this point with ? or h this breaks out which shortcuts are used to stepInto, stepOver, stepOut, continue, quit, and detach.
Use l to list the source code and where you are in the script execution will be marked by a star.
If we start stepping into the code with the s (step into) key (and enter) we can see the first line executing (and showing additional debug information printing the next line) and then the error message, just as before when we ran the entire script.
We can also run our own commands and treat the current debugging context as a normal shell. That means you can call internal variables, functions, you name it, if the script can use it you can use it. (This does not apply to $psboundparameters or the pipeline operator $_, if you want to check the values of these you must assign them within your script.)
If the problem gets more complex than that, I setup a simple “debug and invoke” script, so I can add additional breakpoints at will.
I wanted to show you the shell version because I want to constantly reinforce that PowerShell is really built for you to use as a shell first; these debugging commands are among the easiest I have ever used in a programming language, I didn’t have to suss out any weird flags and the REPL is super friendly.
I also want you to understand when you use Visual Studio Code, the PowerShell ISE, or some other tool that the debugging that is available is generally the one you always have anyway, you dont need some heavy tool to figure out what is wrong with your program!
If you want to get fancier (and potentially emulate some of the additional heavy hitter features of VS Code like watching the value of variables change), Set-PsBreakpoint can also do things like set conditions and fire scriptblocks when you hit your condition and allow you to perform certain actions instead of just break.
A common case is to add additional tests to your breakpoints so that you can ask things like “If the value of $var is X, then break” for things like “I want to break on the fiftieth time this runs” or “If this is true then break”.
The Get-Help Set-PsBreakpoint page shows a lot of really interesting additional examples that I wanted to briefly trot out for completeness, and to remind you that PowerShell help is solid as heck.
Check out more on the online help for Set-PsBreakpoint
PS C:\> Set-PSBreakpoint -Command "Increment" -Script "sample.ps1"
This command creates a command breakpoint on the Increment function in the Sample.ps1 cmdlet. The script stops executing immediately before each call to the specified function.
PS C:\> Set-PSBreakpoint -Script "sample.ps1" -Variable "Server" -Mode ReadWrite
This command sets a breakpoint on the Server variable in the Sample.ps1 script. It uses the Mode parameter with a value of ReadWrite to stop execution when the value of the variable is read and just before the value changes.
PS C:\> Set-PSBreakpoint -Script Sample.ps1 -Command "write*"
This command sets a breakpoint on every command in the Sample.ps1 script that begins with write, such as Write-Host.
PS C:\> Set-PSBreakpoint -Script "test.ps1" -Command "DiskTest" -Action { if ($Disk -gt 2) { break } }
This command stops execution at the DiskTest function in the Test.ps1 script only when the value of the $Disk variable is greater than 2.
It uses the Set-PSBreakpoint cmdlet to set a command breakpoint on the DiskTest function. The value of the action is a script block that tests the value of the $Disk variable in the function.
The action uses the BREAK keyword to stop execution if the condition is met. The alternative (and the default) is CONTINUE.
I am going to kick off a series of blog posts that I hope will help you understand the usefulness and power of PowerShell (or at least come away with some tips and tricks.)
Before I start showing off keyboard shortcuts or breaking down some of the peculiarities you may need to understand to get the full benefits of PowerShell, I want to talk a little about history and why the shell is good.
Before there were modern graphical user interfaces there was the command line.
There were many types of machines leading up to the giant time share computers of the 60s and 70s (and even later in some cases), but back then it was fairly common to write a program ahead of time, encode them in punch cards or otherwise, and then use a shared “terminal” (sometimes just a keyboard or input device, usually at your place of business or school) to submit your work.
After that, you often would get you output either printed back to you or in more modern cases, could even see that output on a screen.
Very quickly on multi user machines it became clear that allowing direct access to the systems functions was not only dangerous, but difficult to use and prone to error. Many programs were written to solve these problems and ease the burden of a fairly complex task.
To facilitate the more “modern” terminals (maybe even supporting iterative input!) many different approaches were taken, and over time a large set of conventions and methods took over the idea of what a shell was to computer operators.
These predecessor programs actually have an out-sized influence on the applications of today, and many shells are descendants that contain some of the zany choices which had to be made due to hardware or software limitations of code 30 years or more ago.
As a result of this many people think that the shell is something from an earlier time or a place only hackers go, some of you may have tried to accomplish your goals but because the shell is so separate from the standard experience, it was probably slow going.
While the shell is definitely closer to the bare metal experience than many of us are used to, it at one time was designed to be the primary user interface, and most shells have many methods to help you deal with the problems baked into a command line interface.
If you’ve never used a shell before or you are familiar with other shells (bash, zsh, cmd, etc) I want to show you that not only is PowerShell not scary, but instead how it will remove drudgery from your day to day work and how using it doesn’t need to feel kludgy.
If you are a SQL professional like me, I want to show you how you can use features of PowerShell to:
I also want you to know that there is an active community of people who want to help you when you run into problems. please come join us at the SQL Community Slack and head on over to #PowerShellHelp or #dbatools.
You can find me there talking as @ck, I would love to hear from you!
I also want to acknowledge a few people as this series begins who have helped and influenced me greatly in these endeavors:
Just wanted to mention a great podcast that some of the dbatools team and I were lucky enough to be invited to attend, the SQL Server Data Partners Podcast
You can listen to the specific episode below: SQL Server Data Partners Podcast – dbatools (Episode 91)
If you haven’t checked the podcast out before, it features two SQL Server professionals Carlos Chacon and Steve Stedman, who do a great job of keeping the conversation light-hearted and momentum moving during some of the more in depth technical conversations. I really enjoy their interview style and I highly recommend checking them out.
Different episodes range widely on the podcast and cover topics such as career advice and experiences, code best practices, and personal interviews from some of the titans of the SQL Server community.
The focus of this episode was dbatools; topics ranged from how the project started and gained acceptance, bringing in new people and maintaining interest in the project, and getting a little deeper into why dbatools mattered to us.
It was really fun to be invited and I was happy to be able to chip in about learning and growing as one of the more junior PowerShellers of the team.
Chrissy and I had such a fun time we are working towards releasing our own dbatools oriented “people talking on the internet type thing” soon!
I wanted to share a scenario and solution for a problem I am seeing arise in the dbatools project:
There are many ways this can happen, but usually due to forgetting to create a feature branch, or accidentally creating said branch from master instead of development.
To fix this problem, you will want check the log of commits to determine the hash of the command you want, and then create a new branch (from the correct source) and apply those commits.
git cherry-pick is a command that allows you to apply a commit on a different branch than what you what you originally intended.
To fix a pull request where you have more files than you want:
git status to see your current branch and git checkout branchname will change your context to the branch name you want.git log command to see a list of commits, you should see your changes and a relevant hash.git checkout developmentgit checkout -b new-feature-name (this will also check it out for you and set it to be the current branch)git cherry-pick hashgit push origin new-feature-nameA note on comparisons, any time you make a new Pull Request GitHub will automatically list the files changed and the number of commits you put in place, if this seems different than what you did, give me a jingle and we can see which part of this process we want to do 🙂
Recently we had a report in the dbatools project: there was an issue installing from the PowerShell Gallery (via Install-Module.)
Error “Invalid characters in path.”
![]()
We had a few scattered notifications of the issue and even one of the dbatools developers affected internally, but it proved to be a stubborn bug and the people involved had tried numerous methods in tracking it down.
We knew that one of the paths being provided to Windows was bad as a part of our module was bad, but the error message sucked and everything worked almost everywhere; we were really confused about what was going on.
It was clear that like any new issue it was a product of new code and changes to the project, but it was unclear which of the hundreds and hundreds of new additions was the source were the culprit.
We had been adding new things at a frenetic pace and this was not something that came up during the standard build process… the final count was 185+ files which might have something to do with this error.
I finally was able to get the source of the problem through attaching my new favorite program dnSpy to my PowerShell process, and I wanted to show you how to do it too.
First, you need to download and extract dnSpy :


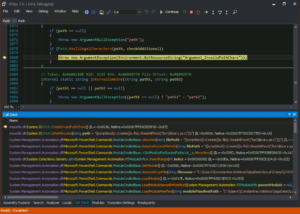
You should now be able to read the methods that were called to get you to this error, and hopefully be able to suss out which methods got which parameters!
When the module loaded and was analyzed, one of our strings in our psm1 file was interpreted as a filepath (but only in WMF 5.0, as stated 5.1 does not have this issue.)
The team was interested in keeping the module installation and setup process as speedy as possible and in that vein the following tweet and blog post came up
Solution? There are few options (like pipe Get-Content to Invoke-Expression), but I ended up with dot-sourcing a script block created from content of the script.
It looks like while this was (and probably is) a great idea, in certain versions of Install-Module it will actually interpret the dot in the dot sourcing as the start of a path, and will attempt to evaluate it as such, throwing an absolute tizz.
In the meantime, dbatools has made changes to effectively do the same thing without using a dot prefix for the line (even though WMF 5.1 is not affected by this issue) and thankfully with a few other changes one of our core contributors Fred was able to find a fix without losing too much time.
For my second TSQL Tuesday post, I wanted to introduce a nifty feature in the dbatools lineup called Restore-SQLBackupFromDirectory, which used Ola Hallengren’s scripts as a baseline to restore a server from a backup folder, however during writing this I came across a newer command that Stuart Moore engineered (Restore-DBABackup) which made it entirely redundant, expect his post coming very soon.
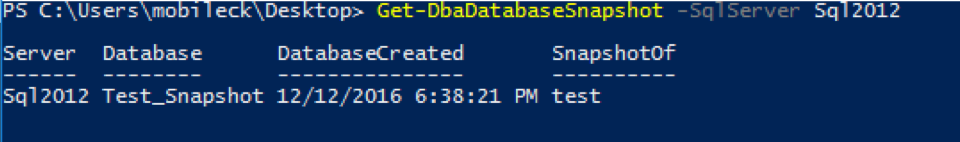
Since there was a bit of a last minute pivot, we are going to do a whirlwind tour of two new PowerShell commands that just hit the lineup regarding database backups, Get and Remove-DbaDatabaseSnapshot.
These along with an additional function coming soon (New-DbaDatabaseSnapshot) are going to make it super simple to create, list, and remove database snapshots on your SQL Server instance.
Get-DbaDatabaseSnapshot -SqlServer <string[]> [-Credential ][-Databases <string[]>] [-Exclude <string[]>]
Returns a list of database snapshots on your SQL Server.
Accepts multiple SQL Servers, and can filter inclusively or exclusively on the base database name to find snapshots.
Remove-DbaDatabaseSnapshot -SqlServer <string[]> [-Credential ] [-Snapshots <string[]>] [-Databases <string[]>] [-Exclude <string[]>]
Drops snapshots from your SQL Server.
This has an additional unique parameter of -Snapshots, which allows you to filter on exact snapshot name instead of using a base database name (in the case of multiple snapshots you want to remove.)

As with many commands in the dbatools lineup there are several common parameters:
SqlServer – Indicates what server you would like to operate on.Credential – Allows you to include an overriding SQL Login credential (PowerShell object),Databases – Operates as an inclusion filter for database names.Exclude – Operates as an exclusion filter for database names.Hopefully after reading today you have two commands ready to help you manage your database snapshots, and I have whet your appetite for the upcoming restore and snapshot commands coming soon!
I was performing some final minor fixes on Find-DbaOrphanFile(helps cleanup files unattached to your server in default directories and additional folders you specify) and ran into an issue parsing the filenames returned.
In the process of changing the code to fix some other issues, IO.Path.GetFileName was added to properly enumerate the paths returned, and when testing it in the dbatools lab (Thanks @ctrlb!!!) it was failing on SQL 2000.
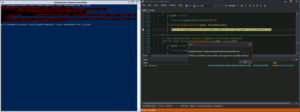
After a few attempts at parsing out slashes and various .trim commands I broke out the command in the PowerShell debugger (which I will detail in another post) and I was thinking of converting everything to numeric representations to double check their character values, but there was no need, the console had done the work for me:

The Find-DbaOrphanedFile (now with an additional ltrim and rtrim in SQL instead) command now works!
As a little aside, why even test SQL 2000?
One of the first things dbatools strove to do was migrate effectively between different versions of SQL Server, and we want to support SQL 2000 up to the most recent SQL version if possible, we do this because we want to offer the cool tools as far back as possible, we know that many people will be using old versions for many years to come.
It hurts sometimes and some of the code can get a bit hacky, but I think most of SQL 2000’s differences are interesting and long term forcing ourselves to manage different versions of SQL Server is reducing the into adding new and fundamentally different databases, such as all the interesting things that are coming with vNext.
And as always, this is one of the many dangers of using undocumented stored procedures 🙂

@sqlbek (Andy Yun) posted a challenge for T-SQL Tuesday 84, where he encouraged people thinking about becoming a speaker to write about their experience giving their first talk, a topic they wanted to present on in the future, or even on starting the road to creating their blog and establishing themselves in the SQL space.
I wanted to flesh out an idea I had for a my first talk that would last under 15 minutes or so. I was thinking of targeting this at a user group (hopefully with a few production DBAs where are interested in learning more about PowerShell) to foment some excitement for and share my experience with dbatools.io
I am here to introduce your to dbatools, an open source project, to talk about my experience going from pure production DBA to PowerShell convert, and to talk to you about how augmenting your skills with some of these commands can mean very little effort expended for a significant payoff.
As a production DBA, I am responsible for a host of things, and I am often a little buried under the mountain of work that piles up, along with every day work, among other things I am responsible for:
My environment is growing rapidly, so I started looking for tools that I could use to help me do my job in a way that didn’t leave me in a cold sweat at night.
dbatools was created help busy DBAs do their jobs, hopefully encoding best practices and reducing the cargo culting in the SQL Server community.
While dbatools was originally designed to migrate your SQL Server instance’s objects from one server to another it is currently expanding into a set of commands (cmdlet reference ) that I think many of my peers in the SQL Server would find very useful.
I first heard about dbatools in the SQL Community Slack and loved the demo on the front page showing how simple a migration is:
I was a bit gobsmacked as I had just finished my own instance migration, and it certainly took a significant amount of time and effort compared to this painless invoking of this cmdlet.
A bit of hanging around and even though I felt unfamiliar with PowerShell development, I was was roped into writing my own cmdlet .
To be frank, looking back at my first draft is painful.
I was worried about my code quality given my experience, and so I asked for some feedback from the head of the project Chrissy LeMaire.
What I got back was almost unrecognizable as my code, and it was one of the first times I was able to see my feral PowerShell (that did the job, badly) turned into something that you could consider idiomatic code.
I learned more in that code review than I had in the previous year of starts and stops in PowerShell land and spent the next week picking it apart and asking questions to cement my knowledge.
In one week I had expanded my PowerShell knowledge by at least 20 times, and felt way more comfortable in working with the team to build some command or troubleshoot an issue! In the end I had a fairly robust cmdlet and with minor bug fixes it made it into the release! I was super happy to have something published in an open source project, but even more, I was happy to have found a series of mentors who wanted to help me build my skills as a PowerShell and database developer.
A few pull requests and a few months later I am confident in my PowerShell abilities to figure stuff out, work through problems, and help newbies through their first steps to contributing to dbatools.
The small scope of PowerShell I have been able to learn and utilize has made things which at one time seemed daunting now seem possible, and even easy.
Now I want to help you make my story your story, contribute to dbatools.
Any time you want to.
dbatools is a community that lives in the #dbatools channel in the SQL Community Slack Any time day or night people are chatting, working on code, listening on feedback to improve the tools, and answering questions for people looking for help using it.
Come and express interest in contributing, we will help you through the rest!
Been a few days of learning since I last wrote one of these, but I have come back to the automatic variables page on the PowerShell documentation enough times that I think I should just blog the important parts for myself.
$? – TRUE/FALSE if the last thing you did succeeded.$_ – Something everyone uses in posh, current pipeline object.$Args – all the undeclared params passed to a function, try to avoid.$Error – the array of error objects that represent a stack of the most recent errors. use $Errors[0] to get the most recent error.$Home – full path of home directory of the current user.$Host – methods to access information about the host we are running the PowerShell command on.$Matches – used with the -(not)match operators, is populated with a hash table of the matched values.$MyInvocation – name, params, values, and information about the current command. Super useful for weird introspection.$OFS – Output File Separator, allows you to set the default file separator for array operations. Generally better to set variables to send to split, this can have downstream effects if you dont change it back.$PID – PID of the process hosting the current PowerShell process.$PSBoundParameters – Nice shortcut to refer to all the params to another script or function.$PsCmdlet – mostly used in advanced functions to access the current running cmdlet’s properties.$PSCommandPath – full path and file name of the script being run.$PSDebugContext – if $null, debugger is not running.$PsHome – path to PowerShell install dir.$PSScriptRoot – directory where script is being run from, avoid if you want to support ps2.$PsVersionTable – returns read only hash table about the current ps session.$Pwd – a path object representing the current directory.$StackTrace – shortcut for the stack trace of the most recent error.$This – refers to an object that is being extended in a script property or method.$true/$false/$null – use boolean login on all of these, nothing new here.Read (slightly) more at about_Automatic_Variables