I was going to dive into a little less meaty topics to start my PowerShell series but I have had a couple requests for debugging pop up, and so that’s where our journey begins.
It’s a little backwards, but I hope you learn a bit about Set-PsBreakpoint and how to ask the shell a few more questions about what the heck it is doing.
Debugging often comes up when you get beyond the super trivial questions and start asking “what is this magical thing doing for me?”
I wanted to include a few terms that may be familiar or may not be (and that’s ok!), but they are good to know when approaching a debugger.
Glossary of terms:
- REPL – Read – Evaluate – Print – Loop – A method to facilitate exploratory programming by allowing a line by line read of your input, evaluate it in the programming language of choice, print the result, and then do it all over again.
- Debugger – Often times a specialized form of a REPL that allows you to step through your code as if you were personally typing them in line by line.
- Breakpoint – A specific callout to the debugger to stop the world when it hits a line, or sometimes with more advanced debuggers (like PowerShell) you can set conditions to break on and hit the “breaks” to check out the state of your program.
- Step-Into – The “default” “expected” step command, this just always chooses to go line by line no matter where the execution path leads. This may sometimes lead you much deeper than you want and then you might want to use Step Over or Step Out.
- Step-Over – This executes whatever is on the current line but returns to the current level/context. This allows you to skip over functions/method calls and not get into their inner workings.
- Step-Out – This executes whatever context you are currently in and then steps to one level up in the hierarchy of calls. This can sometimes lead to the application exiting if your current context is the parent program.
Most commonly when people start debugging their programs they reach for what they know, which is printing stuff to the screen. This is generally considered “printf debugging” (from the old C programming language days), and it has a fairly predictable approach:
- Add a print statement (in PS, this would be best as a call to write-verbose or write-debug and making sure to set
$VerbosePreference="Continue" or $DebugPreference="Continue" to get results.)
- See if the error happens before or after the print statement.
- Add another print statement.
- Continue until you figure it out or give up.
This is a completely valid way of debugging a problem and one I use regularly (especially in SQL), but as you may know there are other methods such as tracing/profiling and in our case, a great debugger!
Any new set of commands can be a complex task, but thankfully with PS you really only need to spend some time on Set-PsBreakpoint, everything else is just supporting that command or outside the scope of this blog post 🙂
Breakpoint Related Commands
- Set-PsBreakpoint – Allows you to trigger a breakpoint at a line, command, or variable, one type of breakpoint at a time (but you can invoke multiple items of that type.)
- Get-PsBreakpoint – Allows you to return a list of any existing breakpoints (verifying what you did helps!) and also to easily pipe these breakpoints to
Remove-PsBreakpoint or Disable-PsBreakPoint so that you can start fresh or quickly disable breakpoints for a “clean run”.
- Remove-PsBreakPoint – Removes any breakpoint you pass to it.
- Disable-PsBreakpoint – Disables a breakpoint you have created with
Set-PsBreakpoint, I dont often use this or Enable-PsBreakpoint because of the technique I list a bit later creating a debug script.
- Enable-PsBreakpoint – Enables a disabled breakpoint you have originally created with
Set-PsBreakpoint.
Non-breakpoint commands, but excellent to know for debugging.
Set-PsDebug -Trace 2 – Allows you to notify EVERYTHING that you want to get deeper debugging information, internal commands will notify you much more about what they are doing.Set-StrictMode -Version 2.0 – This allows you to have a more strict interpretation of what is valid code in your script. StrictMode will complain about references to variables you never initialize, references to properties of an object which do not exist, variables without names and a few less important things.Trace-Command – Allows you to trace execution of a command, (included for completeness but it is a bit outside of our scope right now, we will come back to it in a later post.)
Let’s look at an example, and show you what I am talking about!
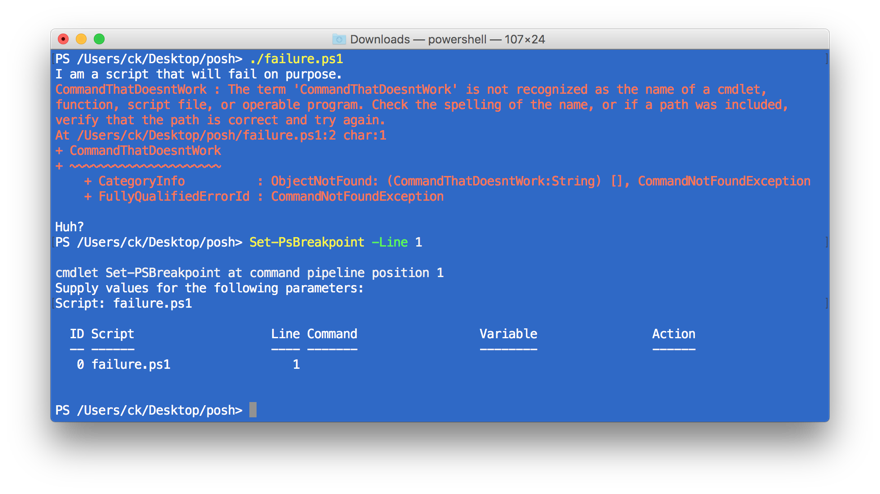
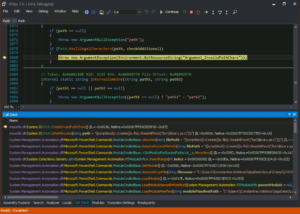
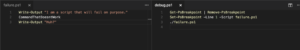
Say you are writing some PS and run into an error:
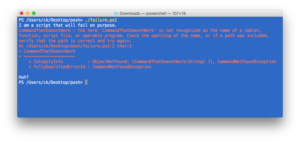
You may notice that the line number itself is thrown in the error message, and one of the things that helps us as a human when debugging an issue in our code. But in this case we can use the line number (and the script) to tell PS to break at that point in the execution and let us start doing things.
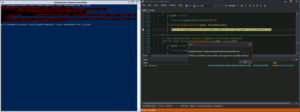
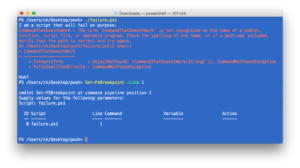
So, let’s start the debugger BEFORE my error occurs and watch it happen 🙂
First we set the Set-PsBreakpoint to break before the line number that threw the error (I forgot to add the script part, so PS helpfully asked what I was talking about.)
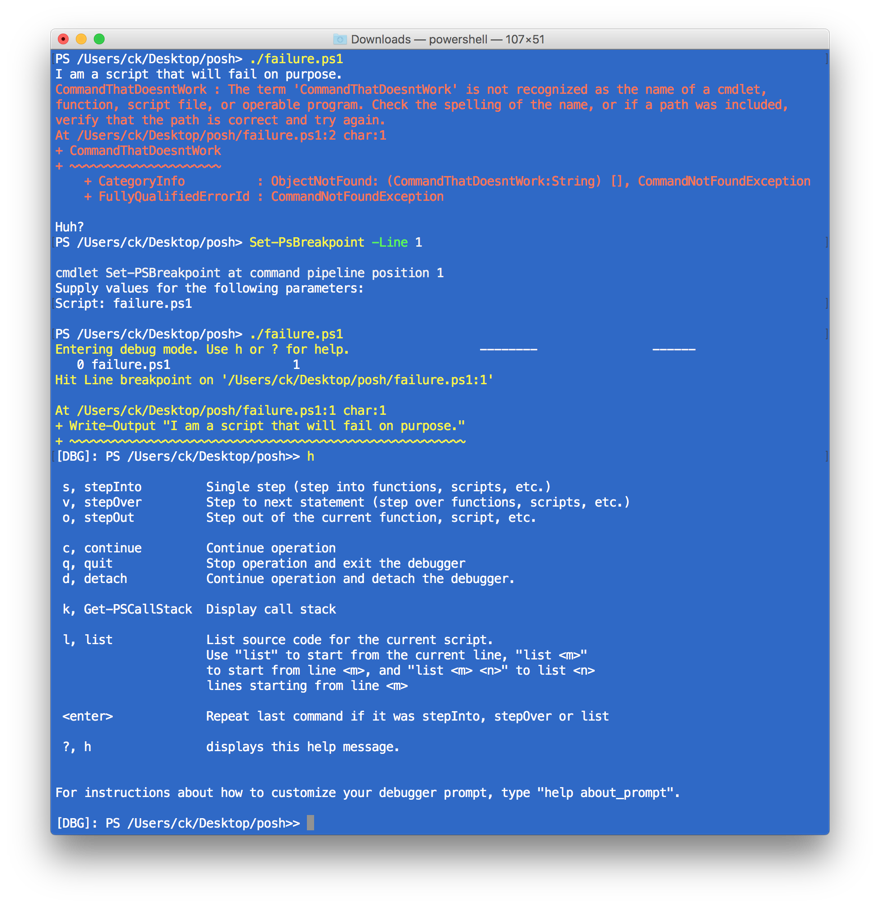
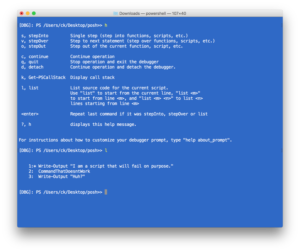
We re-run the command and now we can check out the commands available at this point with ? or h this breaks out which shortcuts are used to stepInto, stepOver, stepOut, continue, quit, and detach.

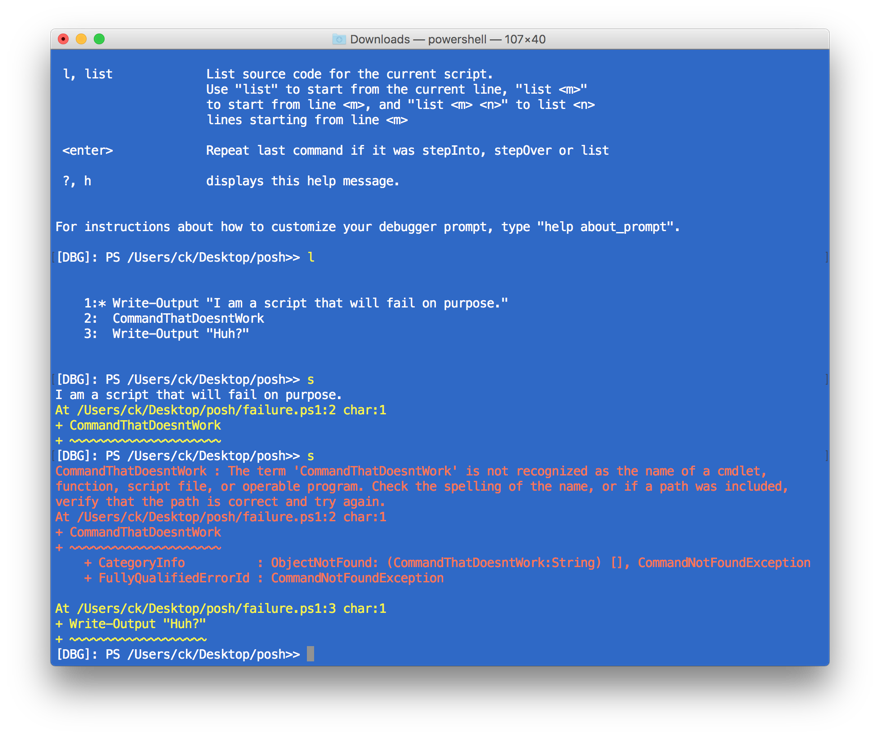
Use l to list the source code and where you are in the script execution will be marked by a star.
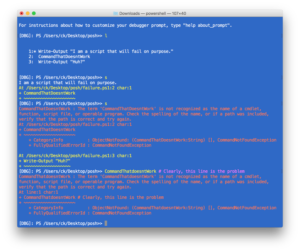
If we start stepping into the code with the s (step into) key (and enter) we can see the first line executing (and showing additional debug information printing the next line) and then the error message, just as before when we ran the entire script.

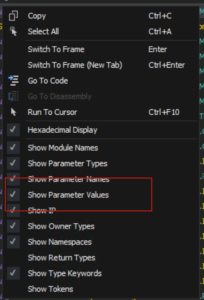
We can also run our own commands and treat the current debugging context as a normal shell. That means you can call internal variables, functions, you name it, if the script can use it you can use it. (This does not apply to $psboundparameters or the pipeline operator $_, if you want to check the values of these you must assign them within your script.)
If the problem gets more complex than that, I setup a simple “debug and invoke” script, so I can add additional breakpoints at will.
I wanted to show you the shell version because I want to constantly reinforce that PowerShell is really built for you to use as a shell first; these debugging commands are among the easiest I have ever used in a programming language, I didn’t have to suss out any weird flags and the REPL is super friendly.
I also want you to understand when you use Visual Studio Code, the PowerShell ISE, or some other tool that the debugging that is available is generally the one you always have anyway, you dont need some heavy tool to figure out what is wrong with your program!
If you want to get fancier (and potentially emulate some of the additional heavy hitter features of VS Code like watching the value of variables change), Set-PsBreakpoint can also do things like set conditions and fire scriptblocks when you hit your condition and allow you to perform certain actions instead of just break.
A common case is to add additional tests to your breakpoints so that you can ask things like “If the value of $var is X, then break” for things like “I want to break on the fiftieth time this runs” or “If this is true then break”.
The Get-Help Set-PsBreakpoint page shows a lot of really interesting additional examples that I wanted to briefly trot out for completeness, and to remind you that PowerShell help is solid as heck.
Check out more on the online help for Set-PsBreakpoint
Example 2: Set a breakpoint on a function
PS C:\> Set-PSBreakpoint -Command "Increment" -Script "sample.ps1"
This command creates a command breakpoint on the Increment function in the Sample.ps1 cmdlet. The script stops executing immediately before each call to the specified function.
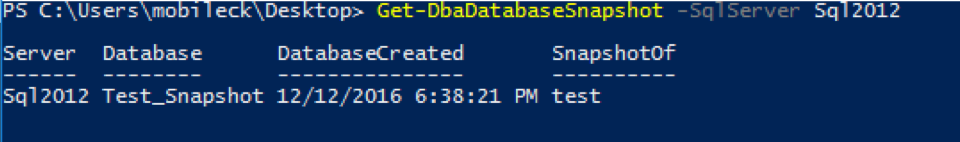
Example 3: Set a breakpoint on a variable
PS C:\> Set-PSBreakpoint -Script "sample.ps1" -Variable "Server" -Mode ReadWrite
This command sets a breakpoint on the Server variable in the Sample.ps1 script. It uses the Mode parameter with a value of ReadWrite to stop execution when the value of the variable is read and just before the value changes.
Example 4: Set a breakpoint on every command that begins with specified text
PS C:\> Set-PSBreakpoint -Script Sample.ps1 -Command "write*"
This command sets a breakpoint on every command in the Sample.ps1 script that begins with write, such as Write-Host.
Example 5: Set a breakpoint depending on the value of a variable
PS C:\> Set-PSBreakpoint -Script "test.ps1" -Command "DiskTest" -Action { if ($Disk -gt 2) { break } }
This command stops execution at the DiskTest function in the Test.ps1 script only when the value of the $Disk variable is greater than 2.
It uses the Set-PSBreakpoint cmdlet to set a command breakpoint on the DiskTest function. The value of the action is a script block that tests the value of the $Disk variable in the function.
The action uses the BREAK keyword to stop execution if the condition is met. The alternative (and the default) is CONTINUE.I was going to dive into a little less meaty topics to start my PowerShell series but I have had a couple requests for debugging pop up, and so that’s where our journey begins.
It’s a little backwards, but I hope you learn a bit about Set-PsBreakpoint and how to ask the shell a few more questions about what the heck it is doing.
Debugging often comes up when you get beyond the super trivial questions and start asking “what is this magical thing doing for me?”
I wanted to include a few terms that may be familiar or may not be (and that’s ok!), but they are good to know when approaching a debugger.
Glossary of terms:
- REPL – Read – Evaluate – Print – Loop – A method to facilitate exploratory programming by allowing a line by line read of your input, evaluate it in the programming language of choice, print the result, and then do it all over again.
- Debugger – Often times a specialized form of a REPL that allows you to step through your code as if you were personally typing them in line by line.
- Breakpoint – A specific callout to the debugger to stop the world when it hits a line, or sometimes with more advanced debuggers (like PowerShell) you can set conditions to break on and hit the “breaks” to check out the state of your program.
- Step-Into – The “default” “expected” step command, this just always chooses to go line by line no matter where the execution path leads. This may sometimes lead you much deeper than you want and then you might want to use Step Over or Step Out.
- Step-Over – This executes whatever is on the current line but returns to the current level/context. This allows you to skip over functions/method calls and not get into their inner workings.
- Step-Out – This executes whatever context you are currently in and then steps to one level up in the hierarchy of calls. This can sometimes lead to the application exiting if your current context is the parent program.
Most commonly when people start debugging their programs they reach for what they know, which is printing stuff to the screen. This is generally considered “printf debugging” (from the old C programming language days), and it has a fairly predictable approach:
- Add a print statement (in PS, this would be best as a call to write-verbose or write-debug and making sure to set
$VerbosePreference="Continue" or $DebugPreference="Continue" to get results.)
- See if the error happens before or after the print statement.
- Add another print statement.
- Continue until you figure it out or give up.
This is a completely valid way of debugging a problem and one I use regularly (especially in SQL), but as you may know there are other methods such as tracing/profiling and in our case, a great debugger!
Any new set of commands can be a complex task, but thankfully with PS you really only need to spend some time on Set-PsBreakpoint, everything else is just supporting that command or outside the scope of this blog post 🙂
Breakpoint Related Commands
- Set-PsBreakpoint – Allows you to trigger a breakpoint at a line, command, or variable, one type of breakpoint at a time (but you can invoke multiple items of that type.)
- Get-PsBreakpoint – Allows you to return a list of any existing breakpoints (verifying what you did helps!) and also to easily pipe these breakpoints to
Remove-PsBreakpoint or Disable-PsBreakPoint so that you can start fresh or quickly disable breakpoints for a “clean run”.
- Remove-PsBreakPoint – Removes any breakpoint you pass to it.
- Disable-PsBreakpoint – Disables a breakpoint you have created with
Set-PsBreakpoint, I dont often use this or Enable-PsBreakpoint because of the technique I list a bit later creating a debug script.
- Enable-PsBreakpoint – Enables a disabled breakpoint you have originally created with
Set-PsBreakpoint.
Non-breakpoint commands, but excellent to know for debugging.
Set-PsDebug -Trace 2 – Allows you to notify EVERYTHING that you want to get deeper debugging information, internal commands will notify you much more about what they are doing.Set-StrictMode -Version 2.0 – This allows you to have a more strict interpretation of what is valid code in your script. StrictMode will complain about references to variables you never initialize, references to properties of an object which do not exist, variables without names and a few less important things.Trace-Command – Allows you to trace execution of a command, (included for completeness but it is a bit outside of our scope right now, we will come back to it in a later post.)
Let’s look at an example, and show you what I am talking about!
Say you are writing some PS and run into an error:
You may notice that the line number itself is thrown in the error message, and one of the things that helps us as a human when debugging an issue in our code. But in this case we can use the line number (and the script) to tell PS to break at that point in the execution and let us start doing things.
So, let’s start the debugger BEFORE my error occurs and watch it happen 🙂
First we set the Set-PsBreakpoint to break before the line number that threw the error (I forgot to add the script part, so PS helpfully asked what I was talking about.)
We re-run the command and now we can check out the commands available at this point with ? or h this breaks out which shortcuts are used to stepInto, stepOver, stepOut, continue, quit, and detach.
Use l to list the source code and where you are in the script execution will be marked by a star.
If we start stepping into the code with the s (step into) key (and enter) we can see the first line executing (and showing additional debug information printing the next line) and then the error message, just as before when we ran the entire script.
We can also run our own commands and treat the current debugging context as a normal shell. That means you can call internal variables, functions, you name it, if the script can use it you can use it. (This does not apply to $psboundparameters or the pipeline operator $_, if you want to check the values of these you must assign them within your script.)
If the problem gets more complex than that, I setup a simple “debug and invoke” script, so I can add additional breakpoints at will.
I wanted to show you the shell version because I want to constantly reinforce that PowerShell is really built for you to use as a shell first; these debugging commands are among the easiest I have ever used in a programming language, I didn’t have to suss out any weird flags and the REPL is super friendly.
I also want you to understand when you use Visual Studio Code, the PowerShell ISE, or some other tool that the debugging that is available is generally the one you always have anyway, you dont need some heavy tool to figure out what is wrong with your program!
If you want to get fancier (and potentially emulate some of the additional heavy hitter features of VS Code like watching the value of variables change), Set-PsBreakpoint can also do things like set conditions and fire scriptblocks when you hit your condition and allow you to perform certain actions instead of just break.
A common case is to add additional tests to your breakpoints so that you can ask things like “If the value of $var is X, then break” for things like “I want to break on the fiftieth time this runs” or “If this is true then break”.
The Get-Help Set-PsBreakpoint page shows a lot of really interesting additional examples that I wanted to briefly trot out for completeness, and to remind you that PowerShell help is solid as heck.
Check out more on the online help for Set-PsBreakpoint
Example 2: Set a breakpoint on a function
PS C:\> Set-PSBreakpoint -Command "Increment" -Script "sample.ps1"
This command creates a command breakpoint on the Increment function in the Sample.ps1 cmdlet. The script stops executing immediately before each call to the specified function.
Example 3: Set a breakpoint on a variable
PS C:\> Set-PSBreakpoint -Script "sample.ps1" -Variable "Server" -Mode ReadWrite
This command sets a breakpoint on the Server variable in the Sample.ps1 script. It uses the Mode parameter with a value of ReadWrite to stop execution when the value of the variable is read and just before the value changes.
Example 4: Set a breakpoint on every command that begins with specified text
PS C:\> Set-PSBreakpoint -Script Sample.ps1 -Command "write*"
This command sets a breakpoint on every command in the Sample.ps1 script that begins with write, such as Write-Host.
Example 5: Set a breakpoint depending on the value of a variable
PS C:\> Set-PSBreakpoint -Script "test.ps1" -Command "DiskTest" -Action { if ($Disk -gt 2) { break } }
This command stops execution at the DiskTest function in the Test.ps1 script only when the value of the $Disk variable is greater than 2.
It uses the Set-PSBreakpoint cmdlet to set a command breakpoint on the DiskTest function. The value of the action is a script block that tests the value of the $Disk variable in the function.
The action uses the BREAK keyword to stop execution if the condition is met. The alternative (and the default) is CONTINUE.